Pre-built Widgets
LogZilla comes packaged with 14 pre-built widgets. Two for event rates, one for LastN (which can be used as-is, or customized), one for messaging, five system widgets, one for messaging, and two for TopN (also highly customizable).
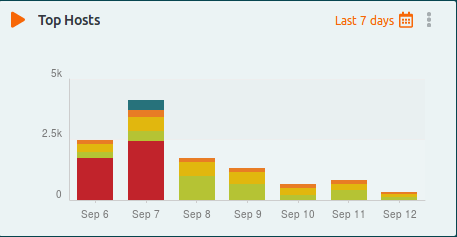
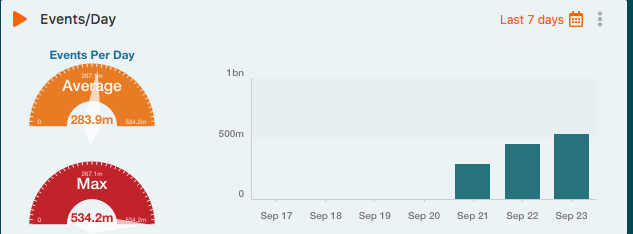
Event Rate Widgets – These widgets give you a quick view of your current and long-term event rates. Large changes in these can give indications of changes in traffic, configuration problems, or security events, among other things. Spikes in these graphs should be investigated as a part of routine maintenance.
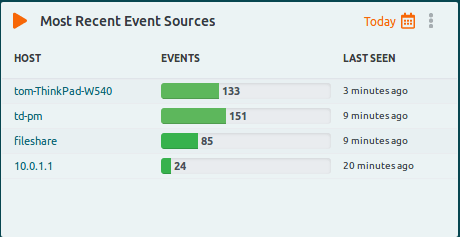
LastN Widgets – The sample widget in this section shows the Most Recent Event Sources. By changing the title and parameters, though, it can display Mnemonics, Hosts, or other data.
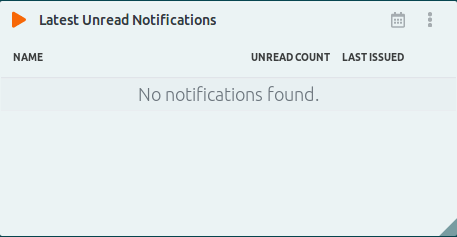
Messaging – This widget displays the Latest Unread Notifications. Notifications are generated by triggers that users create. See the Alerts Overview documentation for more information.
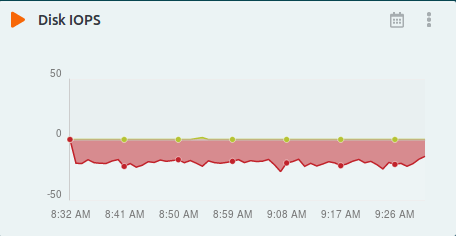
System Widgets – Allow you to monitor the status of your LogZilla server. Options include CPU Load, Memory Usage, Network Utilization, Storage, and Disk IOPS. For high traffic servers that require 100% uptime, these widgets can help indicate issues before they become downtime.
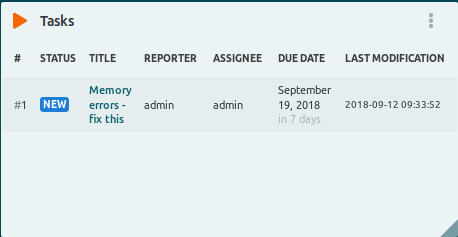
Tasks Widget – This will display any tasks created by, or assigned to the user. Tasks can be created on the Tasks page, or by right-clicking on relevant events in the search results. See the "Tasks" documentation for more information.
TopN Widgets – These widgets include Top Hosts and Top Programs. These can also be customized in many ways, and will be covered below in further detail.