LogZilla Dashboard Import and Export
LogZilla's dynamic system offers comprehensive capabilities for importing and exporting dashboards. The import and export functions are designed with flexibility in mind, allowing users to tailor dashboards as required, promoting the sharing of efficient dashboard configurations across teams and fostering a collaborative work environment.
With these capabilities, users can export a dashboard, execute the necessary changes, then re-import it back into the system. This feature enhances customization, enabling users to configure their dashboards for specific needs, further enhancing the robustness of the LogZilla platform.
In the following sections, we will delve into the structure of LogZilla dashboards, explore the various ways to manipulate them, and provide practical examples to guide you in maximizing these features.
Dashboard Format in LogZilla
A LogZilla dashboard is stored in either a standard YAML or JSON format. These formats facilitate easy sharing and modification of dashboards. The below YAML example depicts the basic structure of a LogZilla dashboard:
- config:
    style_class: infographic
    time_range:
      preset: last_1_hours
    title: Meraki DHCP
  is_public: true
  widgets:
    - config:
        col: 0
        filter:
          - field: program
            value: Meraki DHCP
        row: 0
        show_avg: true
        show_last: false
        show_max: true
        show_min: false
        sizeX: 6
        time_range:
          preset: last_1_minutes
        title: Meraki DHCP Events Per Second
      type: EventRate
config, is_public, and widgets. Each widget contains a config key that specifies the type of the widget and the filter applied to it. The config key also contains layout settings such as column and row placement (col and row), display size (sizeX), and the time range (time_range).
In the next section, we will explore how to manipulate these dashboard configurations through the LogZilla user interface (UI) and the command line.
Manipulating Dashboards in LogZilla
In LogZilla, dashboards can be manipulated or altered in various ways. The dashboard manipulation menu in the UI allows you to Clone, Import, and Export dashboards. In addition, each widget in a dashboard can be modified directly from the dashboard display, allowing for on-the-spot changes.
It's worth noting that these manipulations aren't limited to the UI. LogZilla also supports importing and exporting dashboards from the command line.
Dashboard Manipulation via UI
Here's a look at the dashboard actions that can be performed through the UI:
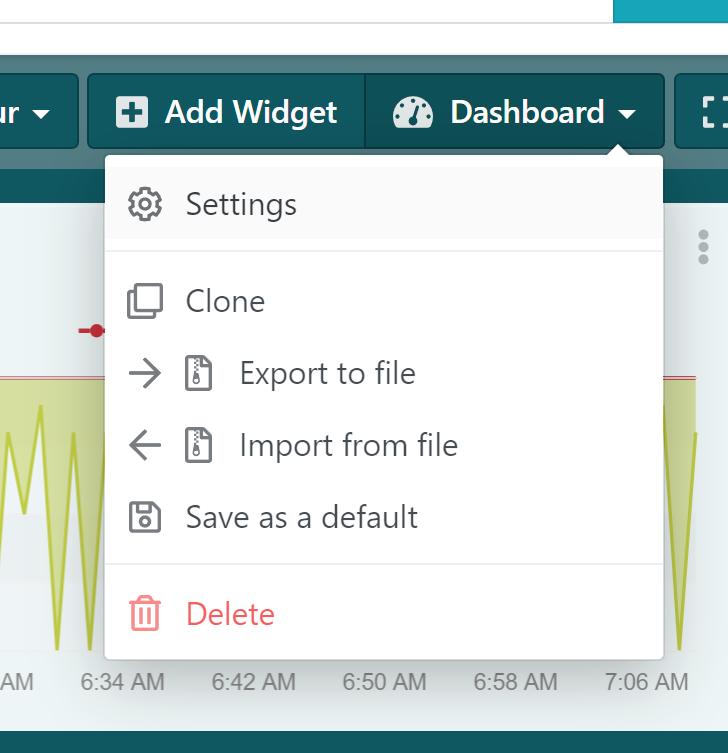
- Clone: This feature allows you to create a copy of an existing dashboard.
- Import: This lets you upload a dashboard configuration file from your machine, thereby reading and loading the dashboard into the system.
- Export: Conversely, this writes a dashboard configuration file and downloads it onto your machine, effectively saving your dashboard for later use or sharing.
Dashboard Manipulation via Command Line
The command line also provides similar capabilities for dashboard manipulation. Here are examples of how you can import and export dashboards from the command line:
Import
To import a dashboard from a JSON file, use the following command:
LogZilla dashboards import -I mydashboards.yaml
Export
To export a dashboard to a JSON file, use the following command:
logzilla dashboards export -O mydashboards.yaml
The -I flag is used to specify the input file for the import command, while the -O flag is used to specify the output file for the export command.
To use the YAML format instead of JSON, add the -F yaml option to the above commands.
In the following sections, we will discuss how dashboards from apps can be used and provide an example of how to export, modify, and import a dashboard.
Using Dashboards from Apps in LogZilla
In LogZilla, dashboards are included with the provided apps. Once an app is installed, you can carry out a full range of activities on that dashboard, including cloning, editing, importing, and deleting.
These features can be very useful when you want to customize the provided dashboards and accompanying widgets for your specific environment.
The Power of App Dashboards
The power of using dashboards from apps is that they often provide useful insights and data visualization out of the box. This can be particularly beneficial when you're getting started or when you need to quickly set up a new dashboard.
However, you might find that while a dashboard from an app provides a good starting point, it doesn't quite meet your specific needs. In such cases, you have the flexibility to modify these dashboards as needed, taking advantage of the importing and exporting capabilities provided by LogZilla.
Example: Exporting, Changing, and Importing a Dashboard
In the following section, we'll walk through an example of how to export, modify, and then import a dashboard in LogZilla.
Scenario: Modifying the "Linux DNSmasq" App Dashboard
Assume that we have installed an app, in this case, "Linux DNSmasq", and it includes a dashboard that is mostly fitting, but not entirely perfect for our needs. We'll use the "Linux: dnsmasq Events" dashboard for this example, specifically focusing on the "dnsmasq-dhcp: Live Stream" widget, which presents a constant stream of incoming DHCP log messages.
In our scenario, by default, this widget displays events of type "query", "cached", and "reply":
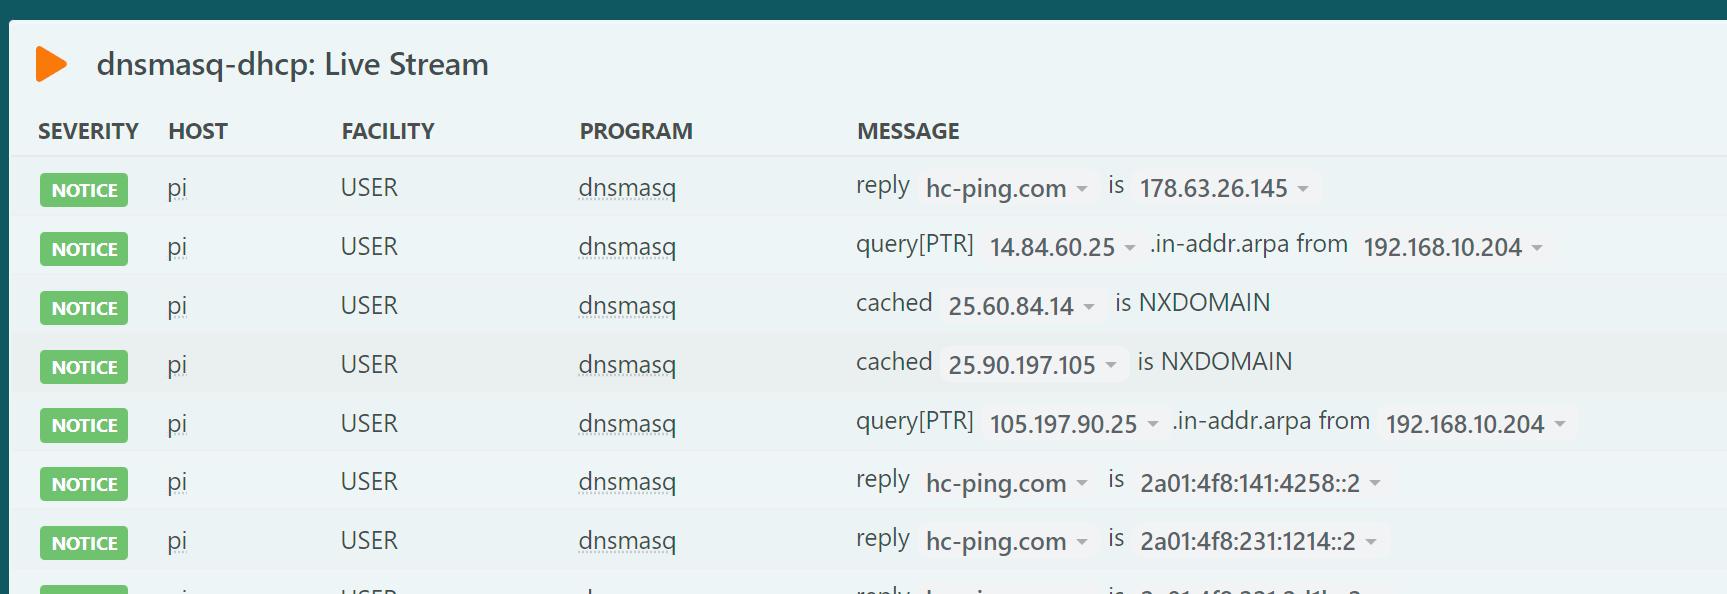
However, for our dashboard's purpose, we are not interested in "cached" events and would prefer not to have our widget display them.
To achieve this, we will:
- Export the dashboard
- Edit the configuration file
- Re-import the modified dashboard
Step 1: Exporting the Dashboard
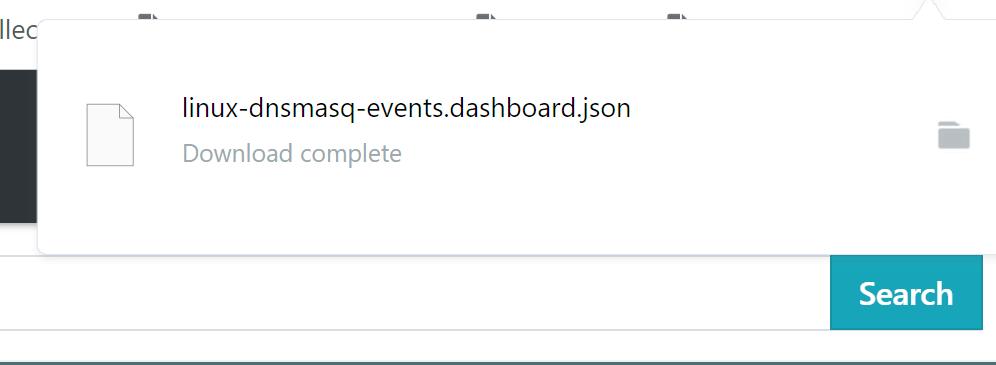
Begin by clicking on "Export to file" as illustrated in the dashboard manipulation menu described earlier. The dashboard configuration file will be downloaded to your preferred location:
Step 2: Editing the Configuration File
After downloading the dashboard configuration file, you'll observe that it contains JSON data all on a single line, without line breaks. To make the file easier to edit, we recommend using a JSON formatter to prettify the JSON data.
The JSON dashboard configuration file starts like:
{
    "config": {
        "style_class": "infographic",
        "time_range": {
            "preset": "last_1_minutes"
        },
        "title": "Linux: dnsmasq Events"
    },
    "widgets": [
        {
And it is followed by widget configuration elements. Navigate to the configuration for our live-stream widget:
        {
            "config": {
                "col": 0,
                "columns": [
                    "severity",
                    "host",
                    "facility",
                    "program",
                    "message",
                    "first_occurrence",
                    "last_occurrence",
                    "counter"
                ],
                "filter": [
                    {
                        "field": "program",
                        "op": "eq",
                        "value": [
                            "dnsmasq*"
                        ]
                    }
                ],
                "limit": 16,
                "row": 1,
                "sizeX": 6,
                "sizeY": 2,
                "sort": "-first_occurrence",
                "title": "dnsmasq-dhcp: Live Stream"
            },
            "type": "Search"
        }
Our goal is to add a filter that excludes messages with the DHCP event type "cached". To do this, we add the following filter:
      "filter": [
          {
              "field": "program",
              "op": "eq",
              "value": [
                  "dnsmasq*"
              ]
          },
                    {
                        "field": "message",
                        "op": "ne",
                        "value": [
                            "*cached*"
                        ]
                    }
        ],
Step 3: Importing the Modified Dashboard
With our changes made, we're ready to replace the old dashboard with the modified one. First, we need to remove the old dashboard using the following command:
logzilla dashboards remove "Linux: dnsmasq Events":
These dashboards will be removed:
id: 270, title: Linux: dnsmasq Events, public: False, widgets: 4
Do you want to remove all selected dashboards [Y/n]
After removing the old dashboard, we can import the modified one with the following command:
logzilla dashboards import -I linux-dnsmasq-events.dashboard.json
The absence of any output indicates a successful import.
Now, returning to our LogZilla UI dashboard (and refreshing it), we see the following:
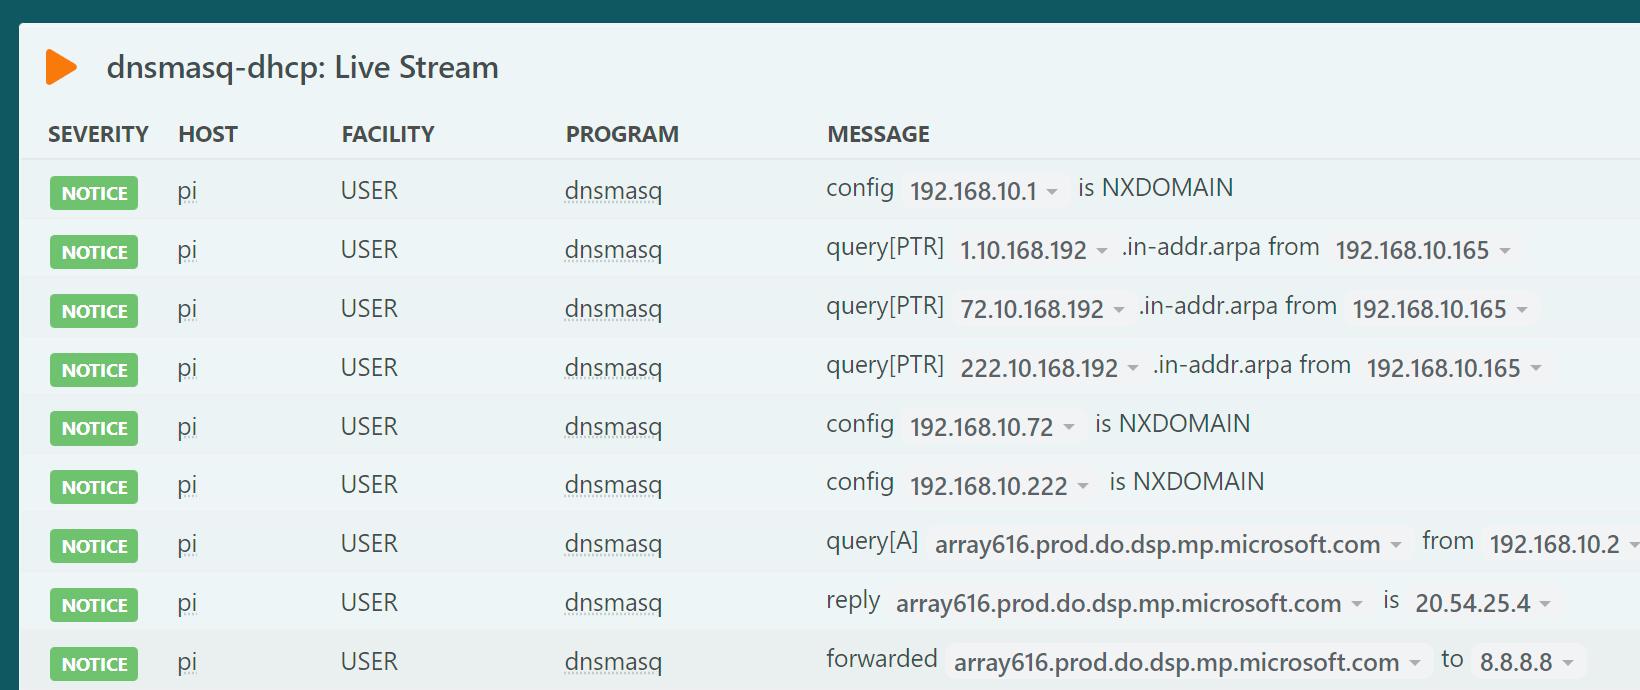
And that's it! Our modified dashboard now displays exactly what we want, demonstrating the power and flexibility of LogZilla's dashboard import/export feature.