Widgets may be created using either a customizable pre-built widget or by performing a search based on the desired filters followed by selecting the Save to dashboard button on the search results page.
Customizing Existing Widgets
Widgets may be customized to display only the data you wish to see. The
following examples show how to set various options for both a
Top Hosts (which are TopN-type charts) and Top Programs widgets.
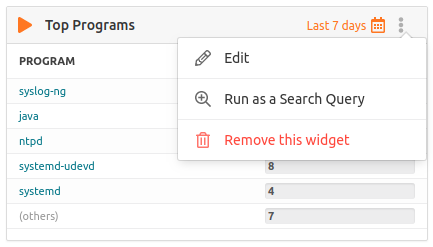
Access the customization menu by clicking the widget’s “options” icon (3 dots). Next, select edit from the menu to access the widget settings.
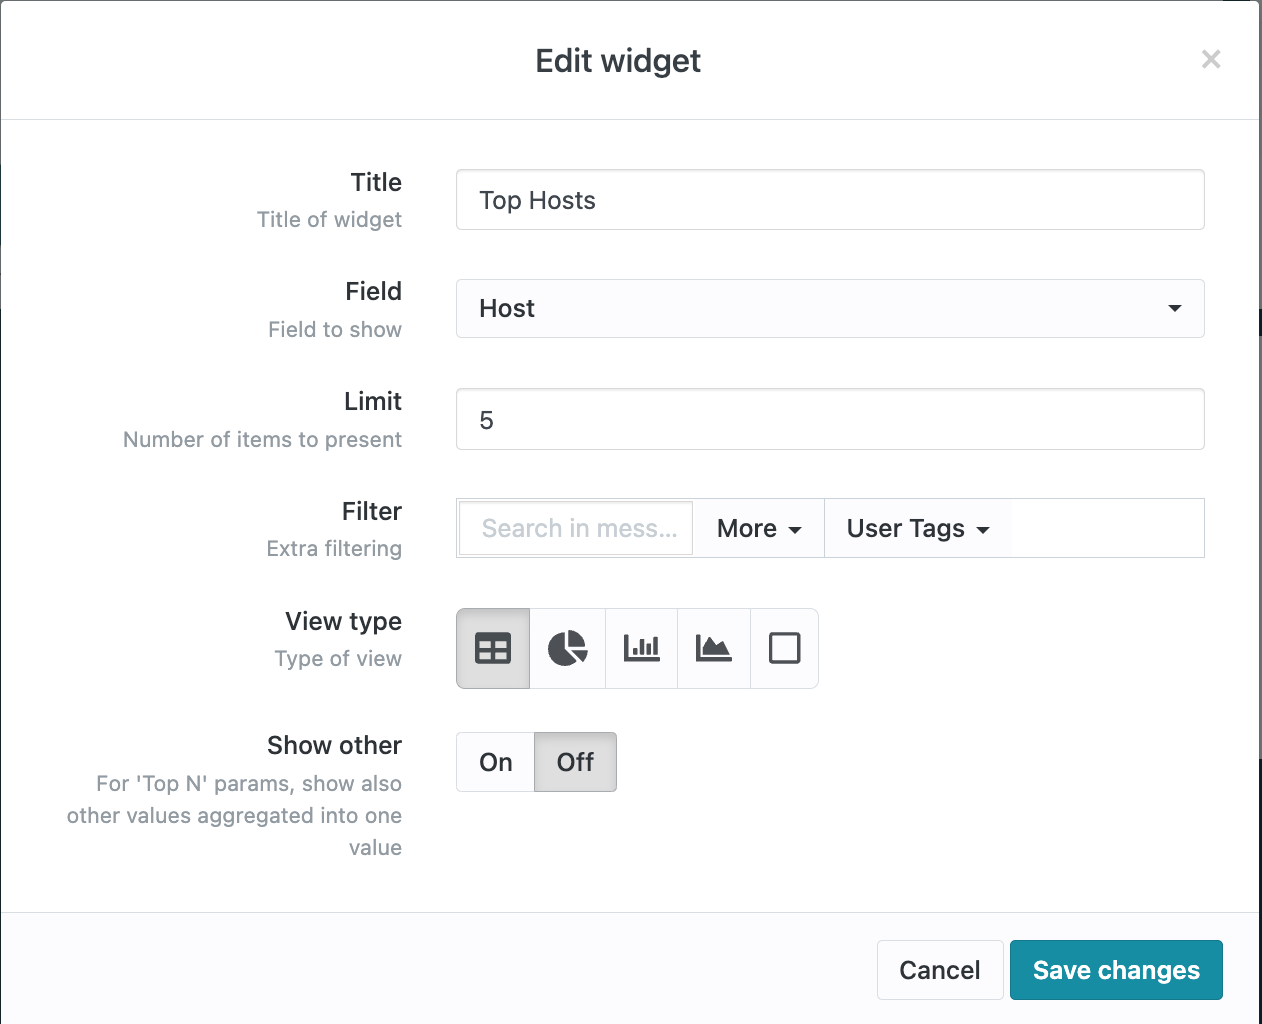
By changing the Title, Description, and Field, we can easily turn this into a widget for showing our top severities.
You can also monitor your top Cisco Mnemonics, or add a search term like ‘failed login’. The Title and Description need to be modified by the user to be clear about the information shown in the widget. The Field lets you decide what data you want to display.
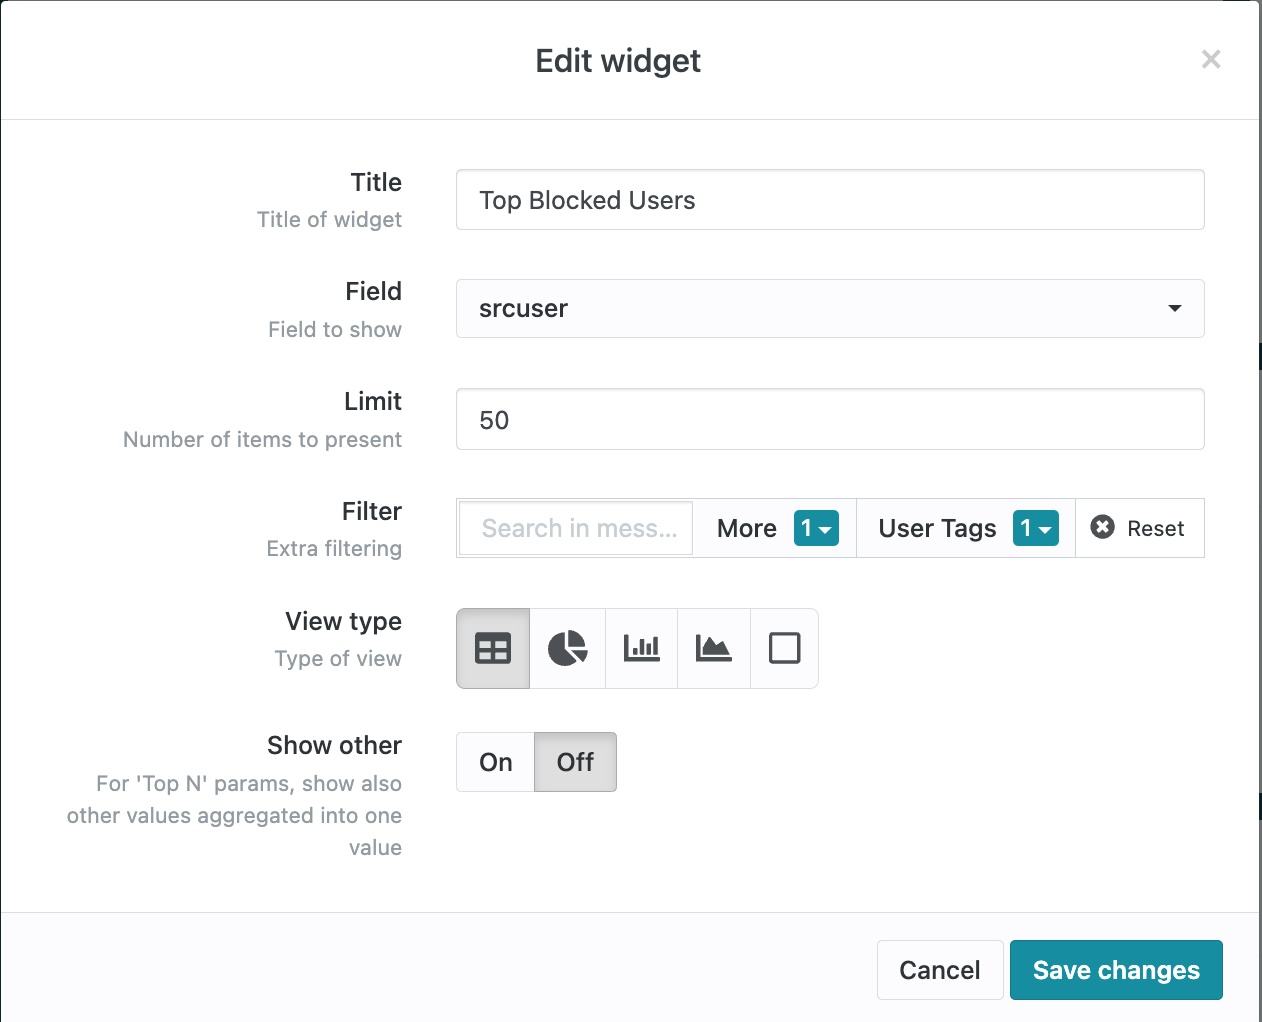
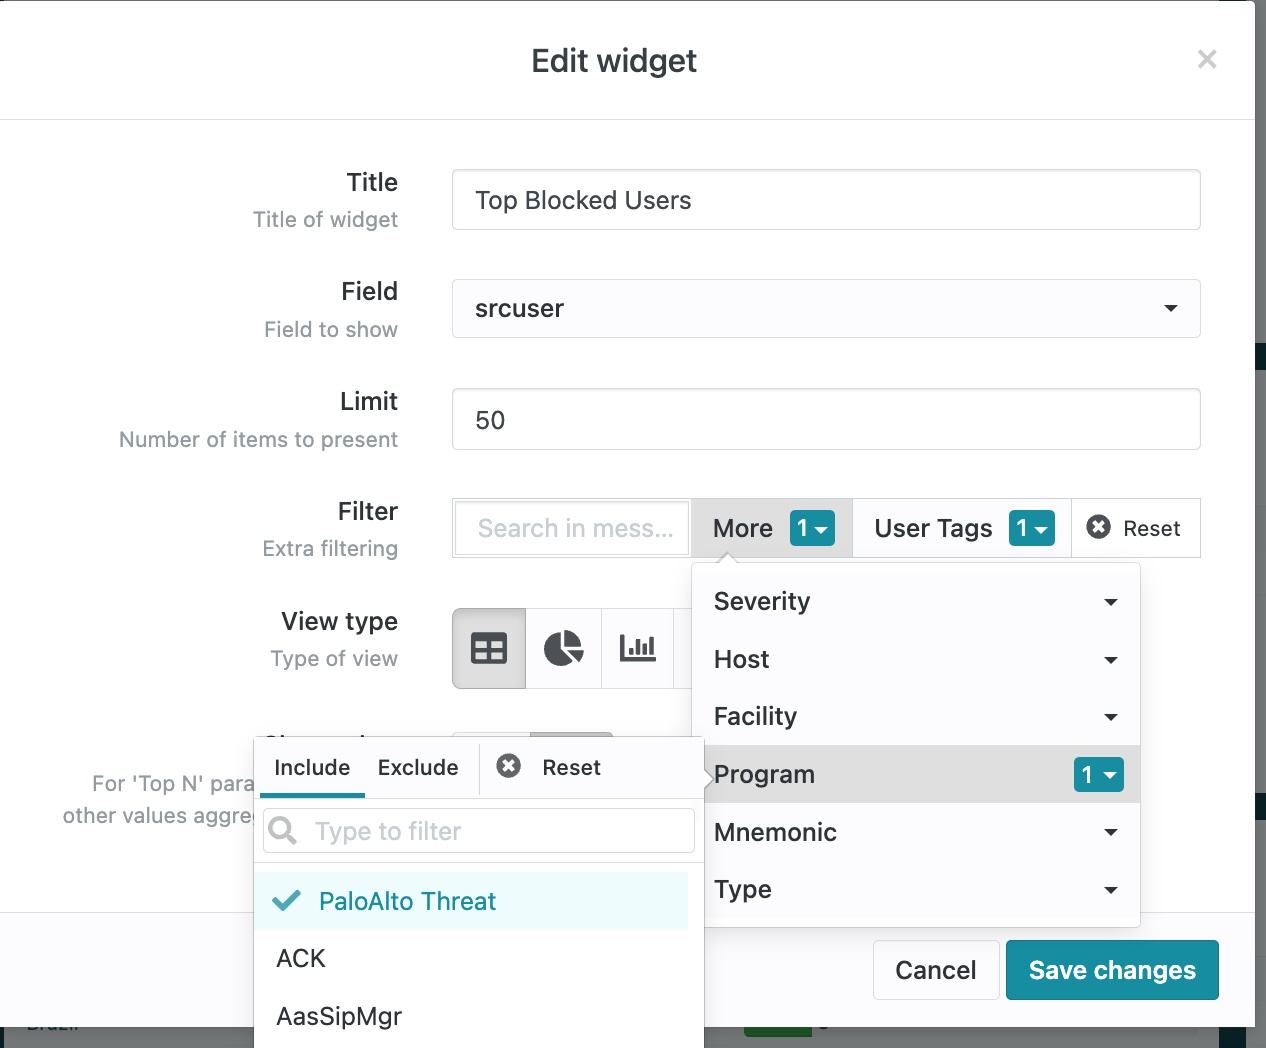
The Filter section lets you narrow your results similarly to the main search bar in LogZilla. You add a search term, such as ‘failed login’, then select all of your Windows servers from the Host section. This will give you a widget that displays only failed login events generated by your Windows hosts. You can similarly filter your results by Severity, Facility, Program, Mnemonic, or Type (Unknown, Actionable, or Non-actionable). So, selecting all ‘CONFIG’ mnemonics would display configuration changes from your routers and switches.
User tags can be used in the filter. User tags are special key/value
pairs associated with each individual event. The LogZilla rules can
parse the data in each event message and then set specific named
(configurable) tags to values from the event data. For example, some
common tags are DstIP and DstPort, respectively representing the
destination IP address and the destination IP port for the given event.
User tag DstIP could for example have value 192.168.0.2.
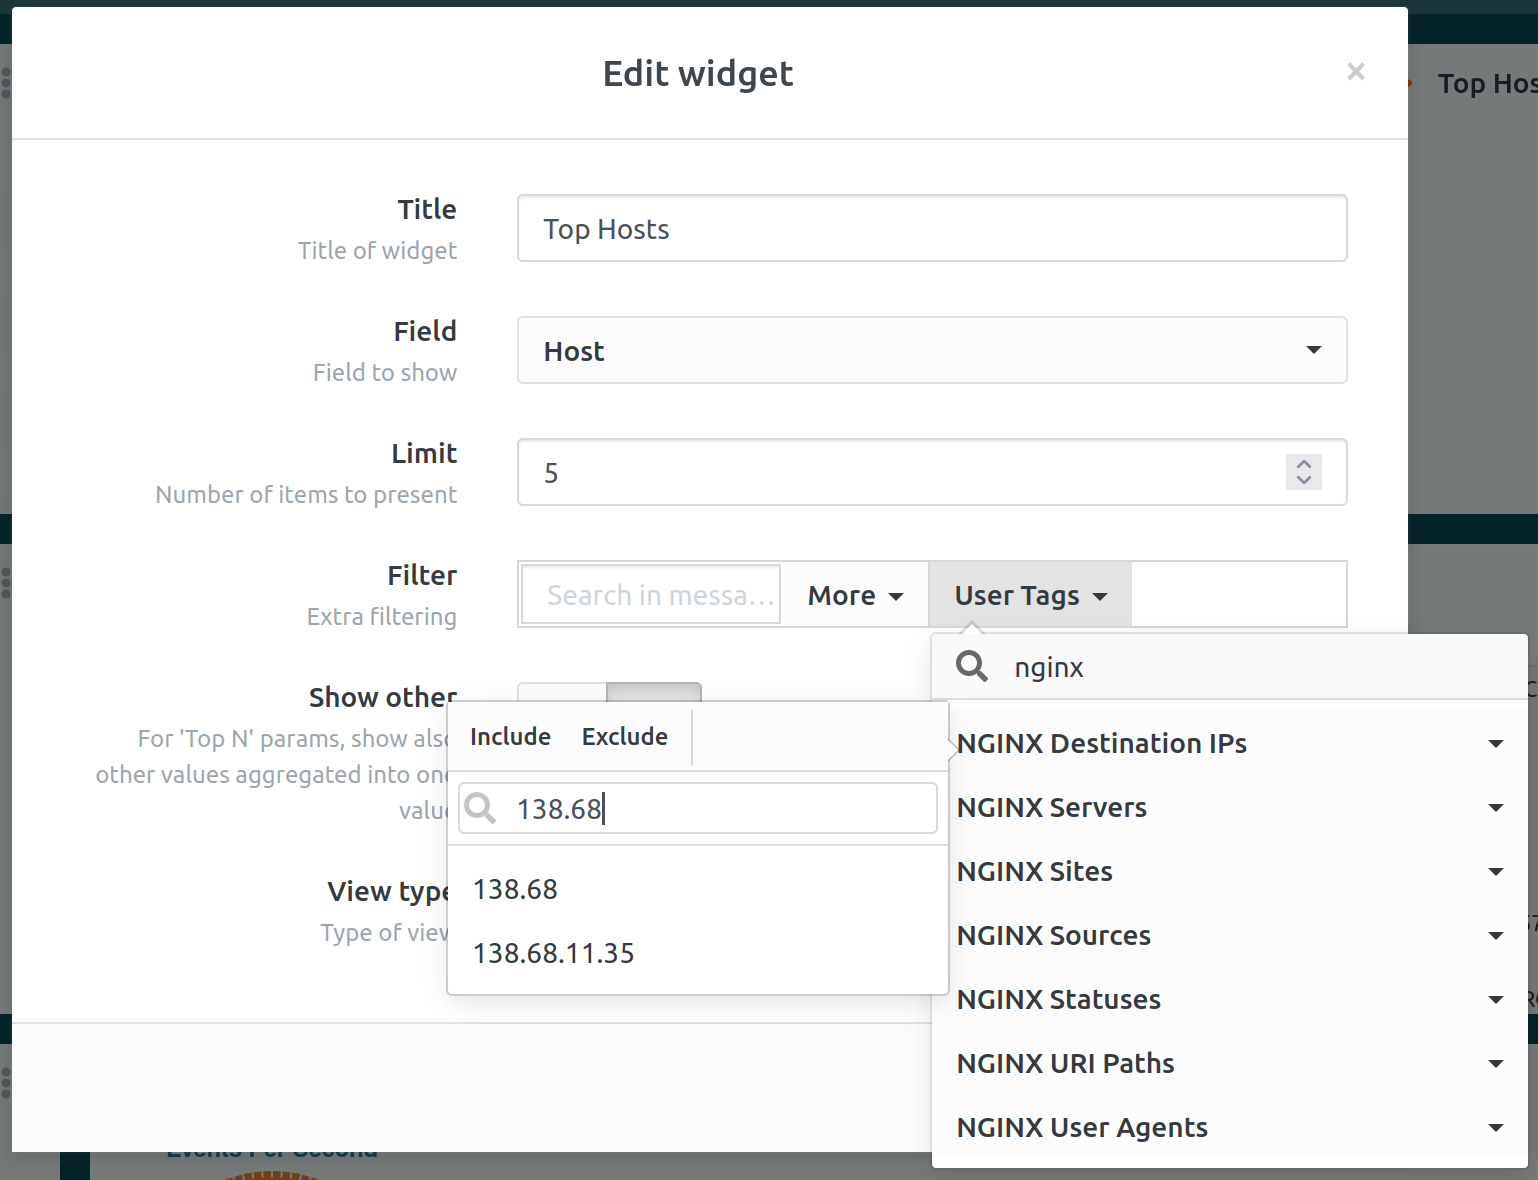
The widget can be filtered based on user tags. If the “User Tag”
dropdown is selected, optionally at the top of the dropdown a filter for
the desired user tag name can be entered (such as if user tag DstPort
is desired then “Dst” can be entered in the search field at the top of
the dropdown, and each user tag with a name containing “Dst”, such as
DstPort will be listed).
Once the desired user tag is shown it can be clicked to open the values dropdown. The values dropdown allows choosing the particular values for the given user tag either to be included or excluded, such that only those events with the chosen values for the designated user tag will be included in the widget, or those with the chosen values will be specifically excluded from the widget. The top of this dropdown as well contains the search box to find particular values of interest. Multiple user tag values can be chosen by clicking on each and a checkmark will be shown next to those so designated as an indicator, or the checked ones can be clicked once more to deselect them.
A special value of * can be typed in, then selected. This value has a
special meaning: it selects only those events that have some value for
the designated user tag. This is useful because not every event may
contain every user tag. For example, there may be events that have no
SrcPort, and those events are not desired to be included. In order to
select only those events that have a value for SrcPort, without
distinction of what that value is, the * filter value should be used.
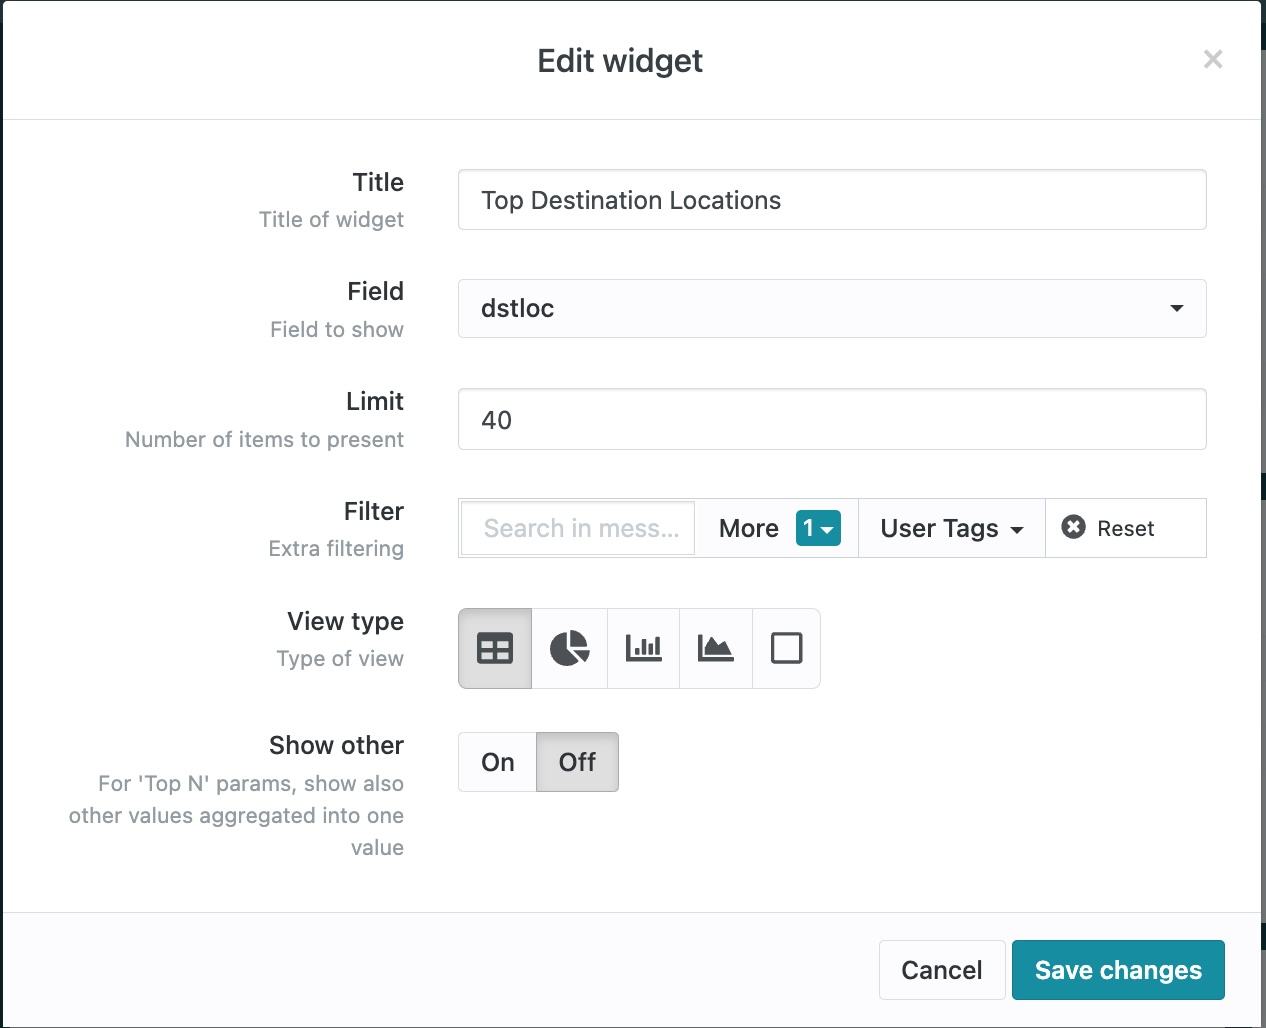
The Limit allows you to control how many results are shown in your widget, while ‘Show other’ toggles the display of items that don’t fit the standard categories of the selected filter. For example, for ‘Top N’ params, it will also show other values aggregated into one value. The final selection is ‘View type’, which allows you to select the chart type that best fits your other widget options.
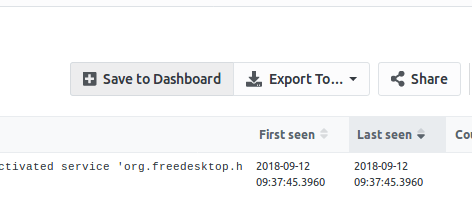
Creating widgets from search results
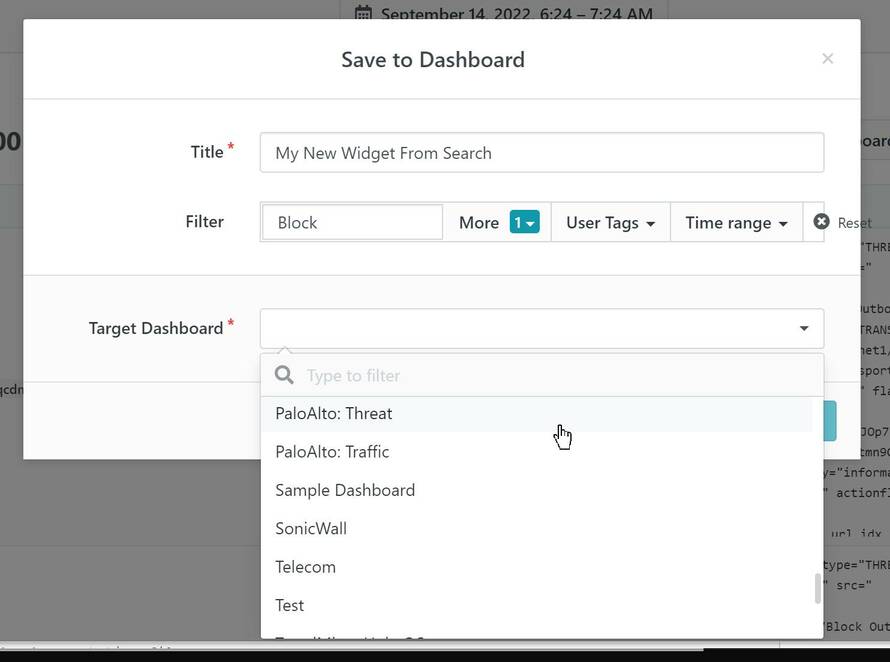
If you find that you run a particular search on a regular basis, you can click the ‘Save to dashboard’ button. This will prompt you to name the widget and select the dashboard that it should be displayed on. You can also modify the search parameters or filters further, if needed.
The display will show updated information on a regular basis. This is ideal for keeping up with ongoing network issues, keeping an eye on intrusion attempts, or even know when users are locked out after consecutive failed logins.
Using Badge (Counter) Type in Rate and TopN Widgets
- Rate Type Widgets: For widgets that show event rates, the badge can display the total count or a summary statistic, like the average rate.
- TopN Widgets: In TopN widgets, the badge can show the count of unique items in the selected field, providing a quick overview of the diversity in the data.
To use a badge in these widgets, select ‘badge’ in the ‘View type’ option. Customize the title, field, and filters as needed to reflect the data you want to showcase.