LogZilla Command Line Maintenance and Troubleshooting
Most of LogZilla operation can be maintained and investigated using the linux command line. There are many linux shell scripts that assist with administration of LogZilla. Where appropriate those scripts are referred to elsewhere in the documentation (section Administration, Command Line Utilities Reference). That section gives the entire list of scripts and their parameters.
These scripts are run via logzilla scriptname [action name] [arguments].
LogZilla Command Line Usage
You must use root permissions, for control of LogZilla’s docker containers.
All logzilla commands are issued using the program logzilla at the command line.
If you type logzilla by itself, you will receive a list of the different
command line options, and if you do logzilla then option -h, it
will show you brief help for that specific option.
Note that the specifics of each of the command line options is documented in
the on-line help section for Administration, Command Line Utilities.
LogZilla Command Line Maintenance
Licenses
LogZilla licensing is based on an events per day limit. When a server exceeds that limit 3 days in a row, access to the UI will be denied with a message letting the user know that they are over their limit. Every server installation generates a unique hash, or license key, so the same key cannot be used more than once.
Using the logzilla license command, you can perform several actions:
list the license status and permitted rate; show the actual license key token;
verify that the license key is correct; download revised license information;
and load license information from a file.
Listing the license status:
root@aaron-videos-lz [~]:# logzilla license info
**** License info ****
Customer   : Unspecified
Is valid   : True
EPD limit  : 1000000000
Expire date: 2023/10/07 10:58:23
Showing the license key:
root@aaron-videos-lz [~]:# logzilla license key
4cc1bef45d600dc699e0c3ecfda156aa1e5afae766820a4d4cc1bef45d600dc6
Verifying the key is correct:
root@demo [~]:# logzilla license verify
License for 4cc1bef45d600dc699e0c3ecfda156aa1e5afae766820a4d4cc1bef45d600dc6 is valid
Downloading revised license information:
root@demo [~]:# logzilla license download
2023-09-13 12:39:38.090989 [89] lz.license INFO Getting license...
2023-09-13 12:39:38.162004 [89] lz.license INFO License for 4cc1bef45d600dc699e0c3ecfda156aa1e5afae766820a4d4cc1bef45d600dc6 downloaded and valid
root@aaron-videos-lz [~]:#
Loading license information from a file:
root@demo:~$ json_pp < /tmp/lic.json
{
   "data" : {
      "apps" : [],
      "customer_info" : "Unspecified",
      "expire_timestamp" : 1696676303,
      "extended_customer_info" : null,
      "features" : [
         "ALL"
      ],
      "host_key" : "4cc1bef45d600dc699e0c3ecfda156aa1e5afae766820a4d4cc1bef45d600dc6",
      "is_demo" : true,
      "is_internal" : true,
      "max_events_per_day" : 1000000000
   },
   "signature" : "EPJxIL/F4dbqd3ZNe3DDhWYZGYaugdhI1JGE7YXLKp3M+X/Mr2nJ0rOhN4k2MejHKXEMdCv+S5SgFNiCqZesSmX0atfDUAVYBve8vzz7vyffQUqyISUJWiyTXDTTfKMRMYrLi7K0p9KKxhN4k2MejHKXEMdCvQ3NbLrvg/eo+pY="
}
root@demo:~$ logzilla license load /tmp/lic.json
2023-09-14 10:42:29.532791 [1] lz.license INFO Loaded license for 4cc1bef45d600dc699e0c3ecfda156aa1e5afae766820a4d4cc1bef45d600dc6
Upgrading LogZilla
The LogZilla web ui will indicate when there is a new version of LogZilla
available. Then to perform the upgrade, you use the logzilla command as follows:
root@demo [~]:# logzilla upgrade
Starting LogZilla upgrade to 'v6.31.0-dev32'
 lz.containers.setup-08bb726e9c194a7a9818d48a2dd1db28 INFO     Pulling image logzilla/runtime:v6.31.0-dev32...
 lz.setup   INFO     Setup init v6.31.0-dev32
 lz.containers.front INFO     Pulling image logzilla/front:v6.31.0-dev32...
 lz.containers.mailer INFO     Pulling image logzilla/mailer:v6.31.0-dev32...
 lz.containers.syslog INFO     Pulling image logzilla/syslogng:v6.31.0-dev32...
 lz.docker  INFO     Decommission: queryupdatemodule, front
 lz.docker  INFO     Decommission: celerybeat, httpreceiver, queryeventsmodule-1
 lz.docker  INFO     Decommission: triggersactionmodule, parsermodule, gunicorn, aggregatesmodule-1, celeryworker, dictionarymodule
 lz.docker  INFO     Decommission: storagemodule-1
 lz.docker  INFO     Decommission: logcollector, tornado
 lz.docker  INFO     Decommission: syslog
Operations to perform:
  Apply all migrations: admin, api, auth, contenttypes, django_celery_beat, sessions
Running migrations:
  No migrations to apply.
 lz.api-setup INFO     Setup admin
 lz.api-setup INFO     Setup internal triggers
 lz.docker  INFO     Start: syslog
 lz.docker  INFO     Start: logcollector, tornado
 lz.docker  INFO     Start: storagemodule-1
 lz.docker  INFO     Start: gunicorn, celeryworker, aggregatesmodule-1, dictionarymodule, parsermodule, triggersactionmodule
 lz.docker  INFO     Start: httpreceiver, queryeventsmodule-1, celerybeat
 lz.docker  INFO     Start: queryupdatemodule, front
 lz.docker  INFO     Start: watcher
LogZilla started, open http://192.168.10.237:80 in your browser to continue
Default login credentials are admin/admin
LogZilla successfully upgraded to 'v6.31.0-dev32'
Setting Configuration Options
Once you have LogZilla properly installed and running, there are multiple
operational configuration settings that can be changed. Note that most of the
critical configuration options can be set using the web UI, on the Settings,
System Settings page. However those same options, and many more are available
using the logzilla config command. If you do that command by itself it will
list all the configuration options.
The options you would change via the logzilla config command are lesser-used
or more system-operational settings that ordinarily are not changed, but here
is how you go about changing them if necessary.
You can get a list of the configuration options and their current values by
doing the logzilla config command by itself. These options are also
documented in help section
Administration, Backend Configuration Options.
Be aware that in most cases,
changing options using the logzilla command will require a LogZilla restart
to take effect, though in certain cases operational interruption can be avoided
by just restarting individual LogZilla docker modules.
One of the options is to control the time frame for the deduplication window. Deduplication is when LogZilla recognizes that multiple copies of the same message are coming in, and rather than recording and responding to each message individually, LogZilla recognizes that it is the same message repeating. Note that in order to recognize that a message is repeating, it must reoccur over a window of time, for example if the window is set for 10 seconds, and the messages reoccur every 11 seconds, LogZilla will not recognize those as duplicates because they are outside the window. By default, the deduplication window is 60 seconds, but this is how you would change that:
root@demo [~]:# logzilla config | grep -i dedup
DEDUP_CACHE_SIZE=180
DEDUP_WINDOW=60

root@demo [~]:# logzilla config DEDUP_WINDOW
60

root@demo [~]:# logzilla config DEDUP_WINDOW 120
DEDUP_WINDOW=120
Another option is the deduplication cache size. This is the maximum number of messages that can be checked for deduplication. If the deduplication cache size is 3, and actually 4 different messages are in a repeating loop, only 3 of those will be deduplicated, with the fourth one just reoccurring as individual messages. The default deduplication cache size is 180, but this is how it can be changed:
LogZilla Troubleshooting
Regarding troubleshooting, many diagnostic and remediation processes can be
accomplished via the command line, both with and without using the logzilla
command.
If LogZilla seems to be operating properly but the web user interface shows no events coming in, and there should be, it is possible there is a problem with the system firewall preventing incoming log events from reaching LogZilla. Note that for Red Hat linux, the default firewall configuration will be configured in this manner, so in order for LogZilla to work on a RHEL system, please see the instructions below.
LogZilla listens on multiple ports, depending on how it has been configured. There is more information about this in Section 4.4.
For typical linux systems, you would use iptables or ufw, or possibly firewall-cmd (for RHEL systems) to control the system firewall. For iptables, use the following command to list all active rules:
For ufw, use the following command to list all active rules:For firewall-cmd (RHEL), use the following command to list all active rules:
In any of these cases, the rules may be configured in various ways that would block the ports LogZilla needs. The individual rules will have to be scrutinized to see if they are configured to do so.
Again, for RHEL, the firewall by default will be configured to prevent incoming traffic to LogZilla. The following commands must be used after LogZilla is installed on a RHEL system, in order for LogZilla to receive events:
firewall-cmd --list-all
firewall-cmd --add-port=514-516/udp --add-port=514-516/tcp --add-port=601/tcp --add-port=6514/tcp
firewall-cmd --runtime-to-permanent
firewall-cmd --list-all
If LogZilla appears to be receving events, or appears to be in a state in which the problem may be more severe than just communications, the first step to troubleshooting would be to check machine operation to see if the problem actually is with logzilla. This would be done by checking cpu, memory, and disk utilization.
First and easiest to determine is disk utilization. Docker can use virtual filesystems that can cause investigation to be more complicated, so use two commands, one to check docker and one to check all except docker.
The first is df -h /var/lib/docker.
Check the results of this to see if “use%” is near 100%:
root@demo [~]:# df -h /var/lib/docker
Filesystem      Size  Used Avail Use% Mounted on
/dev/sda1        90G   88G  1.4G  99% /
If that is the case it is likely LogZilla is using the disk space (though it is possible it is a different program running in a docker container, if any are on the system). In this case, you should remove some of the log data logzilla is maintaining.
Archived historical log events are in the
/var/lib/docker/volumes/lz_archive/_data directory. Underneath that directory
there are one or more storage-# directories (corresponding to however many
storage modules you have configured LogZilla to use, default 1). In the storage
directory there will be multiple directories such as H1693944000, which are
the directories that store the actual archive files:
root@demo [~]:# ll /var/lib/docker/volumes/lz_archive/_data/storage-1
total 33M
drwxr-xr-x 3549 root root 140K Sep 14 05:02 ./
drwxr-xr-x    7 root root 4.0K Feb 16  2022 ../
drwxr-xr-x    3 root root 4.0K Aug  8 06:56 H1660089600/
drwxr-xr-x    3 root root 4.0K Aug  8 06:56 H1660093200/
drwxr-xr-x    3 root root 4.0K Aug  8 06:56 H1660100400/
drwxr-xr-x    3 root root 4.0K Aug  8 06:56 H1660107600/
drwxr-xr-x    3 root root 4.0K Aug  8 06:56 H1660122000/
drwxr-xr-x    3 root root 4.0K Aug  8 06:57 H1660140000/
drwxr-xr-x    3 root root 4.0K Aug  8 06:57 H1660161600/
(...)
Note that the dates of the H1693944000 (etc.) directories are the dates on
which the archive operation was performed by LogZilla. The archive operations
will be automatically performed by LogZilla per the schedule you have
configured in the LogZilla settings. So the archive directories for a given
date will have the data that was for the period starting at the start of the
existing data (for example, 8 days ago) up to the auto-archive date (for
example, 7 days ago) and store that in a directory with today's date.
You can use this information to help decide which archive files to either move or delete. Moving or deleting the files can be done while LogZilla is running, so to free up disk space, these files can be moved/deleted at will. If you decide you want to keep archive files for some arbitrary period of time (for example, a year), after those archive files are moved off, they can selectively be moved back so that LogZilla has access to them again as required.
Note that you can also manually archive log events using the logzilla archive
command, in order to free up even greater disk space by moving LogZilla "hot"
data to "warm" archived data, and then subsequently deleting it or moving it to
"cold" storage off-line. (See below for Archiving Log Data.)
The second is df -h | grep -v "/var/lib/docker:
root@demo [~]:# df -h | grep -v "/var/lib/docker"
Filesystem               Size  Used Avail Use% Mounted on
udev                     7.9G   16M  7.9G   1% /dev
tmpfs                    1.6G  868K  1.6G   1% /run
/dev/sda1                 90G   88G  1.4G  99% /
tmpfs                    7.9G     0  7.9G   0% /dev/shm
tmpfs                    5.0M     0  5.0M   0% /run/lock
tmpfs                    7.9G     0  7.9G   0% /sys/fs/cgroup
/dev/sda15               105M  6.7M   98M   7% /boot/efi
CPU utilization can be checked using the top command:
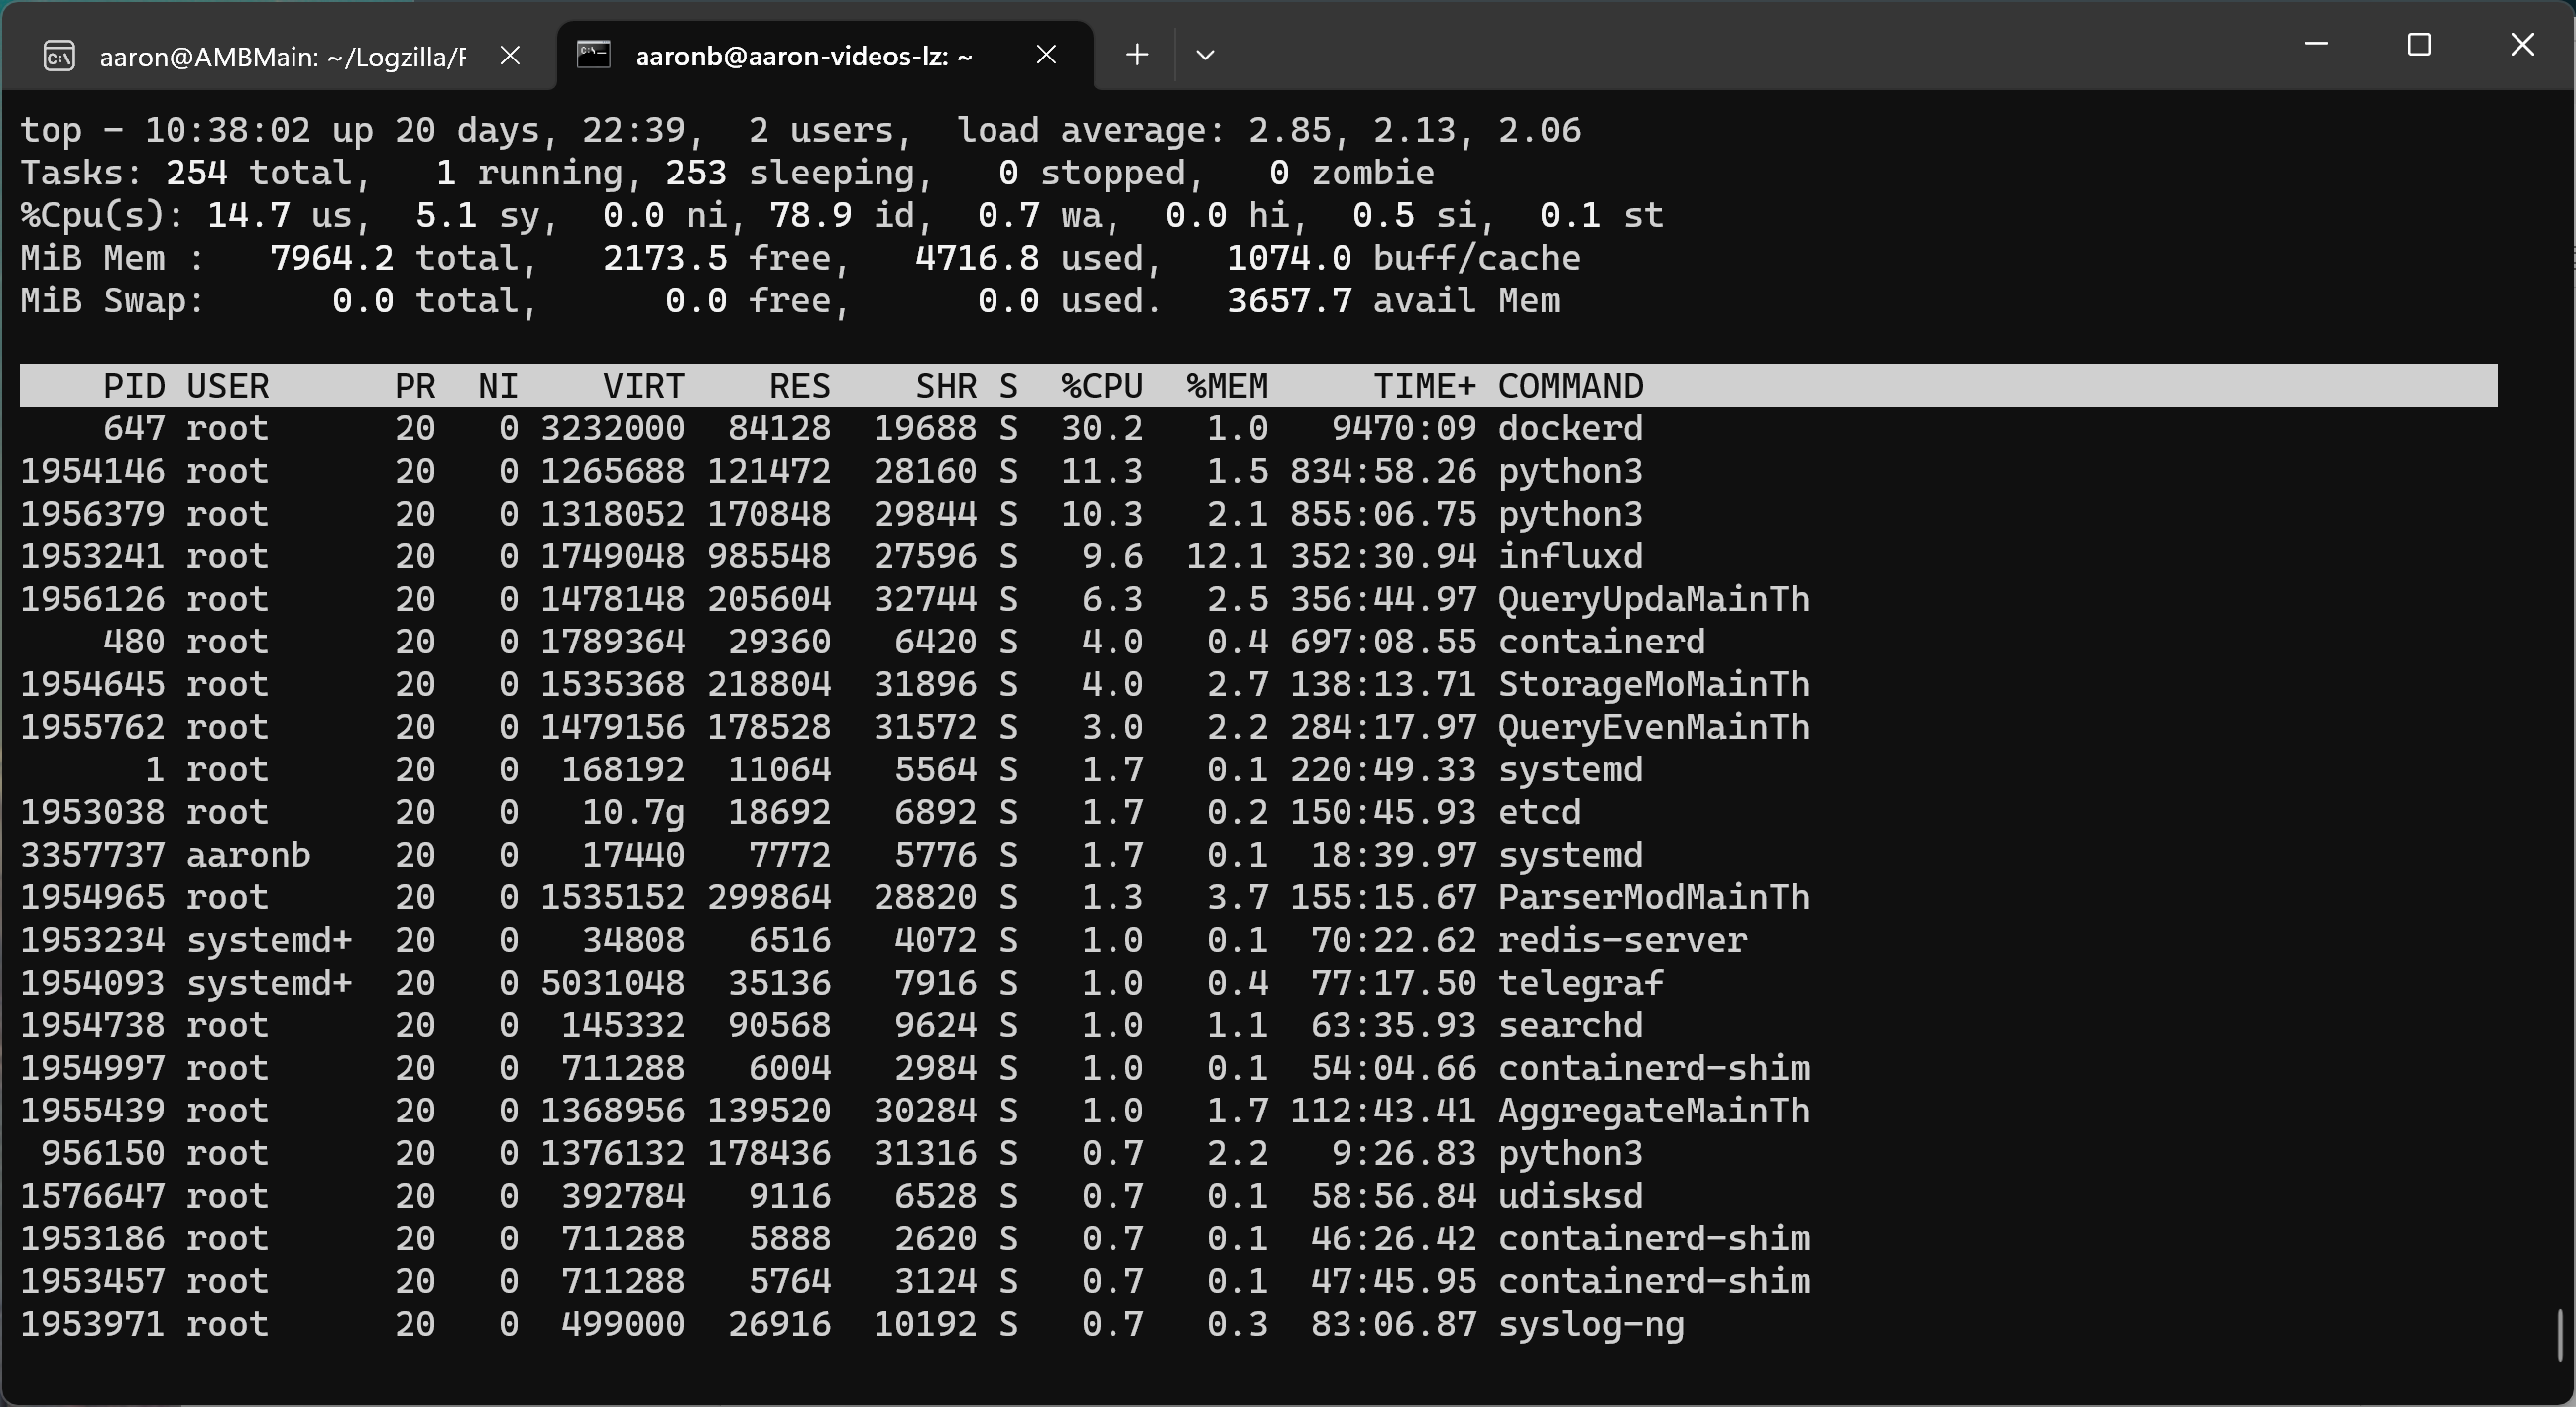
The list is sorted in order of the highest utilization processes at the top to
lowest at the bottom. You would look at the top processes to see if something
out of the ordinary is dragging on the cpu. Normal processes would be dockerd,
python, and influxd.
If python is high you may have a trigger script race condition, which would
temporarily be resolved by logzilla restart but then triggers should be
further investigated to see why logzilla trigger processing is
high-utilization. If otherwise, and you don’t recognize in particular the top
process(es), you would just do logzilla restart and check top afterwards
and LogZilla performance in general to see if the problem has been resolved.
To check if memory is full, use the free -h command:
root@demo [~]:# free -h
              total        used        free      shared  buff/cache   available
Mem:            15G        551M        9.3G         16M        5.8G         14G
Swap:            0B          0B          0B
If “available” is low, less than “100M”, then the system is critically low
and may be having errors. You can determine which process is using the most
memory by running top, then when top is displayed, push M (capital).
(See top image above). Memory usage by process is specified by the “%MEM”
column from the top memory-using process to the lowest. Typically for a healthy
logzilla system, influxd will be the top memory-using process. The exact
percentage used will vary, but if you add up the first 10 processes and are
over 95% this will confirm the system is critically low on memory. If in this
case influxd is using the majority of the available memory then LogZilla has
a combination of too much active data with too much cardinality (cardinality
meaning how many unique vales there are for fields that are indexed by
logzilla). The immediate solution is to archive some of LogZilla's events to
move events from hot-storage to warm-storage.
Look at the section below for directions how to archive logzilla events.
Long-term, you may want to consider reducing the cardinality of events you are
storing. You can see your current event cardinality by doing
logzilla events cardinality:
root@1206r [~]:# logzilla events cardinality
cardinality: 103246
cardinality per field:
        host: 646
        program: 440
        cisco_mnemonic: 169
        facility: 18
        severity: 8
        type: 3
cardinality per tag:
        MAC: 80046
        SrcIP to DstIP: 80029
        srcuser: 35196
        src_port: 5609
        DHCP Client ID: 4029
        dst: 2115
        src: 1531
(...)
        NetworkDeviceGroups: 4
        proxy_act: 4
        act: 3
HC TAGS:
        DstIP
        DstIP Mapped
        SrcIP
        SrcIP Mapped
        SrcIP to DstIP
        SrcIP to Port
If your cardinality is over “200,000” you may want to contact logzilla support for further help in how cardinality may be able to be addressed.
If the system itself is not at capacity in disk, memory, or cpu, then the next
thing to do is to check the logzilla.log file, which is in the
/var/log/logzilla/ directory. Most LogZilla problems will be indicated here.
A convenient way to narrow down what may be going wrong is to do
grep -v -e INFO -e WARNING /var/log/logzilla/logzilla.log to skip
“informational” and “warning” messages:
If that doesn’t show any obvious smoking gun, try including the warning messages:
grep -v -e INFO /var/log/logzilla/logzilla.log.
root@demo [~]:# grep -v -e INFO /var/log/logzilla/logzilla.log
2023-09-13 04:00:27.553919 [storagemodule-2] lz.storage WARNING Can't insert data (13 events). ArchivedChunk[2/1691589600] is archived
2023-09-13 07:14:29.075110 [gunicorn/6] django.request WARNING Unauthorized: /api/
2023-09-13 07:28:33.790477 [dictionarymodule/1] lz.DictionaryModule WARNING Detected high cardinality tag 'SrcIP to DstIP'
root@demo [~]:#
Regarding solutions, the simplest and most frequent command is just
logzilla restart, which causes logzilla to shut down gracefully then start
back up. You can selectively restart LogZilla modules if you want to keep
LogZilla operational but restart one of the LogZilla services, or handle if
only one of the modules is having a problem.
First, you can check to see if all the LogZilla modules as docker containers
are running. Do docker ps | grep lz_ to list just the LogZilla containers,
and their statuses (docker ps | grep lz_ | less -S can be easier to read).
root@demo [~]:# docker ps -a | grep lz_
510b793c4806   logzilla/runtime:v6.31.0-dev32    "python3 -O /usr/lib…"   24 hours ago   Up 24 hours lz_watcher
e0ee5120a201   logzilla/runtime:v6.31.0-dev32    "python3 -O /usr/lib…"   24 hours ago   Up 24 hours lz_queryupdatemodule
996d5d101c8d   logzilla/front:v6.31.0-dev32      "/docker-entrypoint.…"   24 hours ago   Up 24 hours 0.0.0.0:80->80/tcp, :::80->80/tcp lz_front
f4279739308a   logzilla/runtime:v6.31.0-dev32    "python3 -O /usr/lib…"   24 hours ago   Up 24 hours lz_queryeventsmodule-1
9bd0e47a4f23   logzilla/runtime:v6.31.0-dev32    "python3 -O /usr/loc…"   24 hours ago   Up 24 hours lz_celerybeat
328e43b20c19   logzilla/runtime:v6.31.0-dev32    "python3 -O /usr/loc…"   24 hours ago   Up 24 hours lz_httpreceiver
d5f55a4544a3   logzilla/runtime:v6.31.0-dev32    "python3 -O /usr/lib…"   24 hours ago   Up 24 hours lz_triggersactionmodule
db738ad075c4   logzilla/runtime:v6.31.0-dev32    "python3 -O /usr/lib…"   24 hours ago   Up 24 hours 0.0.0.0:32412->11412/tcp, :::32412->11412/tcp        lz_parsermodule
bd9923fb6a46   logzilla/runtime:v6.31.0-dev32    "python3 -O /usr/lib…"   24 hours ago   Up 24 hours lz_dictionarymodule
150cb17faa64   logzilla/runtime:v6.31.0-dev32    "python3 -O /usr/lib…"   24 hours ago   Up 24 hours lz_aggregatesmodule-1
9efc5d5459ad   logzilla/runtime:v6.31.0-dev32    "python3 -O /usr/loc…"   24 hours ago   Up 24 hours lz_gunicorn
627ac9220a1e   logzilla/runtime:v6.31.0-dev32    "python3 -O /usr/loc…"   24 hours ago   Up 24 hours lz_celeryworker
de0e2eeb81ff   logzilla/runtime:v6.31.0-dev32    "python3 -O /usr/lib…"   24 hours ago   Up 24 hours lz_storagemodule-1
59492b9f6785   logzilla/runtime:v6.31.0-dev32    "python3 -O /usr/lib…"   24 hours ago   Up 24 hours lz_tornado
6cc46bd2b150   logzilla/runtime:v6.31.0-dev32    "python3 -O /usr/lib…"   24 hours ago   Up 24 hours lz_logcollector
b1acd5e61e86   logzilla/syslogng:v6.31.0-dev32   "/usr/local/bin/dock…"   24 hours ago   Up 24 hours lz_syslog
2c69b9743982   logzilla/runtime:v6.31.0-dev26    "/usr/lib/logzilla/s…"   26 hours ago   Exited (0) 26 hours ago lz_setup-cba016503b38468a982ba281a15343c2
0022c807d545   logzilla/mailer:v6.31.0-dev26     "/init-postfix"          3 days ago     Up 3 days lz_mailer
99684da609b6   telegraf:1.20.4-alpine            "/entrypoint.sh tele…"   7 days ago     Up 7 days lz_telegraf
128e1d31ad8b   postgres:15.2-alpine              "docker-entrypoint.s…"   7 days ago     Up 7 days 5432/tcp lz_postgres
22332285ccca   influxdb:1.8.10-alpine            "/entrypoint.sh infl…"   7 days ago     Up 7 days 127.0.0.1:8086->8086/tcp, 127.0.0.1:8086->8086/udp lz_influxdb
fa887e08793c   redis:6.2.6-alpine                "docker-entrypoint.s…"   7 days ago     Up 7 days 6379/tcp lz_redis
13dc29e0972d   logzilla/etcd:v3.5.7              "/usr/local/bin/etcd"    7 days ago     Up 7 days lz_etcd
Each of the logzilla containers is prefixed by lz_.
There should be 22 containers, and if one is not running you can
restart just that module. Now, for example, if email is not being sent, you
can restart the email module, using logzilla restart, as follows:
root@demo [~]:# logzilla restart -c mailer
 lz.docker  INFO     Restarting container mailer...
 lz.docker  INFO     Done
 ```

If all the LogZilla docker containers are running, then the `logzilla config`
command can be used to check the LogZilla operational parameters to make
sure they are configured as you would expect, such as to make sure LogZilla
is listening on the appropriate ports, various limits are set correctly,
etc. (as mentioned above).

Next, you can use the `logzilla shell` command to inspect operation of the
various logzilla modules in their *docker* containers. For example, if mail is
not being sent, you can check to verify that none of the mail processes have
stopped for some reason. The simplest option is to restart the mailer
container, as previously mentioned, but if desired you can do a more in-depth
investigation. You do the command `logzilla shell -c containername command`:
With the `logzilla shell` command you put the name of the container, excluding
the leading `lz_`. After the container name you put the command you want to
execute inside that container. For troubleshooting, starting with the shell is
helpful. Then to check the email processes, just do `ps`, and you should see
the three processes `postfix/master`, `qmgr`, and `pickup`:
If LogZilla rules do not seem to be executing properly, it is possible that a
run-time error occurred in processing a rule. Note that even though a rule
passes the rule test file, there may be situations encountered in real-world
log message processing that result in the rule encountering an error.

To check to see if there are any rules errors, use `logzilla rules list`:
200-cisco cisco lua enabled - 202-cisco-cleanup cisco lua enabled - 500-bind linux__bind lua enabled - 900-broken-rule user lua disabled 20 999-program-cleanup program_cleanup lua enabled -
You can see the status for the rule with the error is `disabled` and there
are `20` errors encountered, before the rule was automatically disabled.
You can get the specific error details using `logzilla rules errors`:
Event: cisco_mnemonic: EMWEB-6-REQ_NOT_GET_ERR counter: 1 extra_fields: HOST_FROM: staging SOURCEIP: 192.168.10.204 _source_type: cisco_wlc facility: 16 first_occurrence: 1694688702.419517 host: 218.173.223.27 id: 0 last_occurrence: 1694688702.419517 message: "%EMWEB-6-REQ_NOT_GET_ERR: http_parser.c:616 http request is not GET\r" program: Cisco Wireless severity: 6 status: 0 user_tags: {}
Error: /etc/logzilla/rules/user/900-broken-rule.lua:9: bad argument #1 to 'match' (string expected, got nil) stack traceback: [C]: in function 'match' /etc/logzilla/rules/user/900-broken-rule.lua:9: in function ======================================================================
If an error has been encountered, the error details will indicate where in the
lua code the error occurred (in this case, line `9`) and why
(`bad argument #1 to 'match' (string expected, got nil)`).


### Archiving Log Data

Use the `logzilla archives` command to archive events:
2023-09-13 12:29:26.538796 [7] lz.archives INFO Task finished root@demo [~]:# ```